Cape Town
UTC+2South Africa · SAST
Sun, 9 Aug 2026
Timezone Guide
Cape Town, South Africa runs on UTC+2. This time zone stays fixed year-round at UTC+2 — daylight saving time is not observed. There is a 6-hour difference between Cape Town and New York. Standard 9-to-6 working hours overlap for about 3 hours a day with New York. A good time to connect: 15:00–18:00 in Cape Town lines up with 09:00–12:00 in New York. There is a 1-hour difference between Cape Town and London. Standard 9-to-6 working hours overlap for about 8 hours a day with London. A good time to connect: 10:00–18:00 in Cape Town lines up with 09:00–17:00 in London. There is a 7-hour difference between Cape Town and Tokyo. Standard 9-to-6 working hours overlap for about 2 hours a day with Tokyo. A good time to connect: 09:00–11:00 in Cape Town lines up with 16:00–18:00 in Tokyo. This timezone is also shared with cities such as Madrid, Paris, Amsterdam. Keeping these offsets in mind makes it easier to schedule calls or travel to and from Cape Town.
Practical Info
Cape Town (South Africa) is home to roughly 4.7M people. Today brings about 10.1 hours of daylight: sunrise at 07:36, sunset at 17:42. This time zone stays fixed year-round at UTC+2 — daylight saving time is not observed. It sits in the Southern Hemisphere, about 34° south of the equator. Traffic drives on the left.
Flag
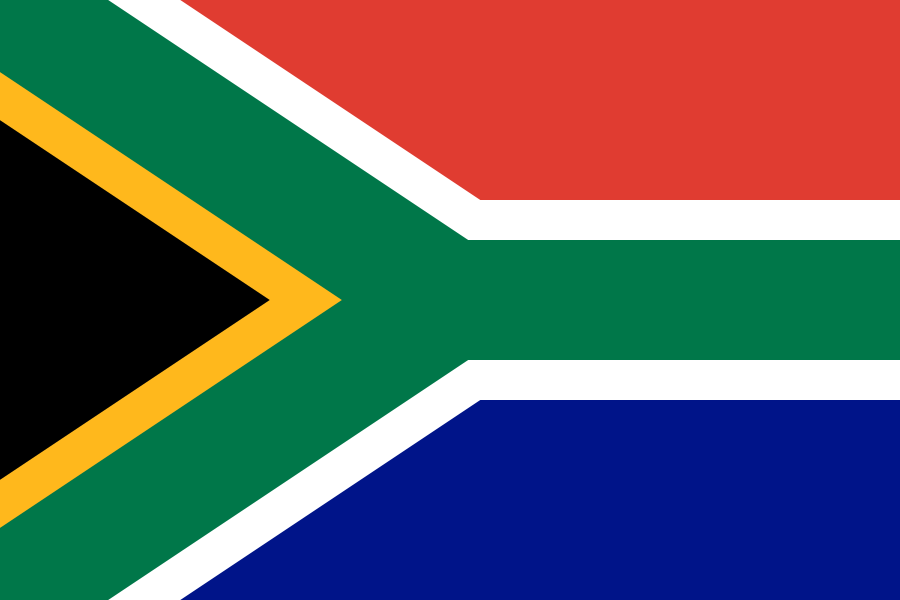
South Africa
Capital
Pretoria
Continent
Africa
Time Zone
SAST · Africa/Johannesburg
Coordinates
33.92°S, 18.42°E
Currency
ZAR (R)
Calling Code
+27
Driving Side
Left
Hemisphere
Southern
Language
English
Measurement System
Metric
Did You Know?
The City That Published the Date It Would Run Out of Water
1. In early 2018, Cape Town told four million people exactly which day the taps would be turned off.
They called it Day Zero. It was defined as the moment the city's dams fell to 13.5% of capacity — at which point municipal supply would be cut to hospitals and other critical services only, and everyone else would queue for water at 200 collection points.
After three consecutive years of poor rainfall, dam levels had fallen to 25% by late January 2018.
2. The ration was 25 litres a day. The target to avoid it was 50.
A typical urban resident uses around 200 litres a day. Cape Town asked its residents to live on 50 — the lowest target ever set during a drought anywhere, and in line with the WHO's minimum for maintaining health and safety. Under Day Zero itself, the figure would have dropped to 25 litres, collected by hand and carried home.
3. The city put a countdown on the motorway.
Electronic boards on the freeways, normally used for traffic information, displayed how many days of water the city had left. A public dashboard published weekly dam levels. A city-wide map let households compare their consumption with their neighbours'. The weekly water report became a topic on the radio and at dinner tables.
4. And then the date kept moving.
Day Zero was first projected for April. Then fixed at 12 April 2018. Then pushed to 11 May. Then to 4 June. Then to 9 July.
In June 2018 the region received average rainfall for the first time in four years, dam levels rose, and the city called Day Zero off indefinitely.
By then Capetonians had cut their water use by almost 60% from 2015 levels, giving the city one of the lowest per capita consumption rates of any major city in the world.
The clock: South Africa runs a single time zone, UTC+2, calculated for the 30th meridian east. Johannesburg sits close to that line and is only about eight minutes off its own solar noon.
Cape Town is at 18.4° east — nearly twelve degrees further west — which leaves it roughly 46 minutes ahead of its own sun. Same country, same clock, a thirty-eight minute difference in what that clock actually means.
So: a city that scheduled its own catastrophe, published the date, watched it move four times, and then cancelled it — by getting four million people to use a quarter of the water they had used three years earlier.
Sources
- Northeastern Global Resilience Institute (Ocak 2018 sonunda barajların %25'e düşmesi; Day Zero'nun %13,5 kapasitede tanımlanması; 200 dağıtım noktasında kişi başı 25 litre; 12 Nisan 2018 tarihi)
- ScienceDirect, Brühl & Visser (2016-2018 kuraklığında kişi başı günde 50 litre hedefi — bir kuraklıkta konmuş en düşük hedef; DSÖ asgarisiyle uyumu)
- Grist (otoyollardaki elektronik tabelalarda kalan su günü sayısı; haftalık baraj raporları; şehir çapında tüketim haritası; Haziran 2018'de dört yılın ilk ortalama yağışı)
- Princeton Successful Societies (2015 seviyesine göre yaklaşık %60 azalma; dünyadaki en düşük kişi başı tüketim oranlarından biri)
- AP / Fox News (tarihin 12 Nisan'dan 11 Mayıs'a, 4 Haziran'a ve 9 Temmuz'a ertelenmesi)
- National Geographic Education (dört milyon nüfus; normal kentli tüketimin ~200 litre olması)
- Boylam hesabı: Cape Town 18,4°D ve Johannesburg 28,0°D, UTC+2 meridyeni 30°D
Annual Daylight
Working Hours
7h overlap